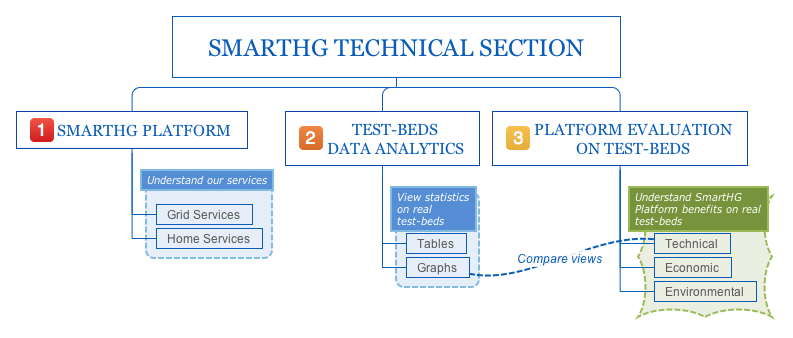
Click on the picture to be redirected to the desired section.
The Technical Section is the place where to know everything about SmartHG Platform, Test-beds, and technical, economic and environmental evaluation of the Platform on our Test-beds.
We have evaluated our SmartHG Platform when applied to our Test-beds, and computed what were consumption, energy prices, and CO2 emissions in several experimental scenarios. We have collected such information in this interface and here we show statistics on such results.
- Technical Evaluation shows the same graphs available for measurements taken from test-beds, but applied to our experimental results. Thanks to this interface, it is possible to see how demand and consumption change after applying SmartHG Platform, both at substation and residential level. As an example, one can see differences in typical aggregated (or not) demand profile, distribution of number of users with respect to annual or average demand, …
- Economic and Environmental Evaluation shows statistics and analytics of SmartHG Platform benefits in terms of: energy costs reduction, CO2 emissions reduction, and peak shaving obtained at substation level.