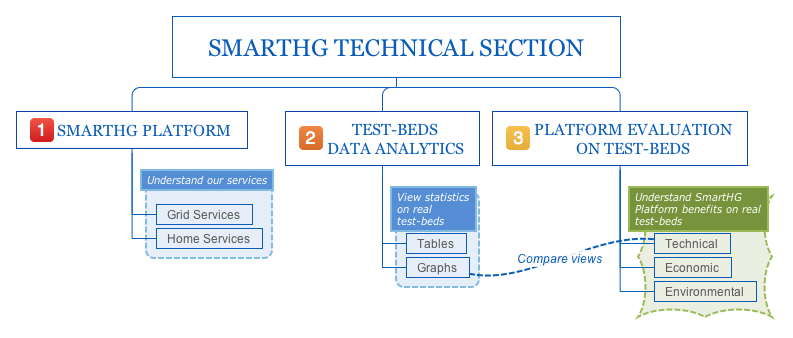
Click on the picture to be redirected to the desired section.
The Technical Section is the place where to know everything about SmartHG Platform, Test-beds, and technical, economic and environmental evaluation of the Platform on our Test-beds.
We suggest to navigate the picture from right to left to completely appreciate the products of our projects, as enumerated in the following list.
-
SmartHG Platform exposes fully functioning prototypes of our services.
The Platform is an integrated collection of software instruments, useful to the Distribution System Operator, to the Energy Retailer, and to each Residential user connected to the Electrical Distribution Network. Such instruments are applied to data gathered from the hardware deployed in the context of the SmartHG project (smart plugs and clamps gathering measurements on main meters and specific appliances). More information on deployed hardware can be found in the Showcase section of our website and in the Tables available on Test-beds Data Analytics.
The Platform software is composed by Grid Services (for storing all measurements gathered from deployed hardware, for optimising Electrical Distribution Network operations, and for generating individualised fair and safe power profiles for all users of each substation in the Network) and Home Services (for forecasting the residential user behaviour in order to generating individualised suggestions for each user on how to reduce energy usage and costs). - Test-beds Data Analytics is a collection of statistics on SmartHG test-beds, namely Svebølle (Kalundborg, Denmark), Central District (Israel), and Minsk (Belarus). Statistics are shown in terms of tables and charts. As for tables, we show the number of measurements stored in our databases (taken both from deployed sensors and from historical data), the number of sensors deployed in all houses, and for each house in each test-bed the number of sensors deployed, divided by producer. As for graphs, we show significant aggregations at substation level (aggregations and averages on users demand) and at residential level.
- Platform Evaluation on SmartHG Test-beds finally shows evaluation of the SmartHG Platform on data from our test-beds. This is the place where to visualise all benefits of our platform in terms of optimising electrical network operations by reducing substations load, in terms of economic advantages and environmental positive impact.