
View Graphs in This Page
Click on the picture to be redirected to the desired section.
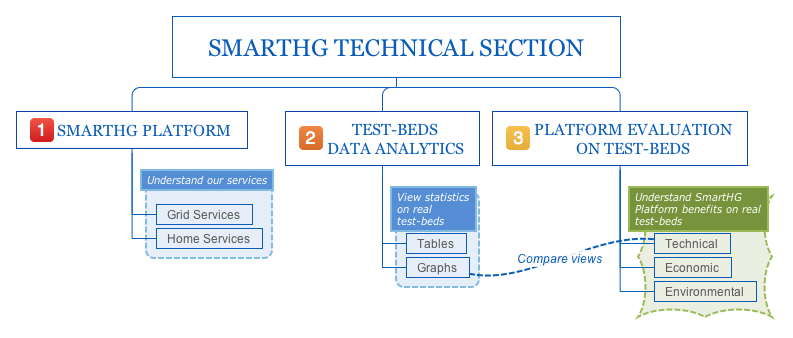
The Technical Section is the place where to know everything about SmartHG Platform, Test-beds, and technical, economic and environmental evaluation of the Platform on our Test-beds.
In this page we show graphs on data gathered from our test-beds.
This interface shows several views for SmartHG test-beds, chosen among Svebølle, Central District, and Minsk.
Once the test-bed is selected in the appropriate drop-down menu, views are organised at substation or residential level for which also there is a specific drop-down menu.
In this context, with demand we mean consumption (loads) minus production (photo-voltaic in our test-beds), both at substation and at residential level. More on definitions: with aggregated we mean the sum at substation level of all single demands or consumption, while average simply means averaging on all householders connected to a substation at each hour.
At substation level, analytics on aggregation and average on demand on the entire substation are shown.
In particular, they are: typical daily aggregated and average demand profiles, aggregated and average demand profiles on the whole period, distributions of the number of users with respect to both average daily and annual demands, proportion of aggregated consumption per kind of appliance, and aggregated consumption profile per kind of appliance.
At residential level, analytics on single householders (anonymised for security and privacy reasons) are shown.
In particular, they are: typical daily profile, demand profile on the whole period, proportion of consumption per kind of appliance, and consumption profile per kind of appliance.
When choosing a particular view at a specific level in a desired test-bed, more descriptions on such graph will be displayed.
Finally, this interface is supplied in different languages, namely English, Russian, and Danish. The preferred language can be chosen by clicking on the corresponding flag.
Graphs
First choose a test-bed clicking on the drop-down menu, then the level between substation and residential, finally select the desired view.