View Tables in This Page
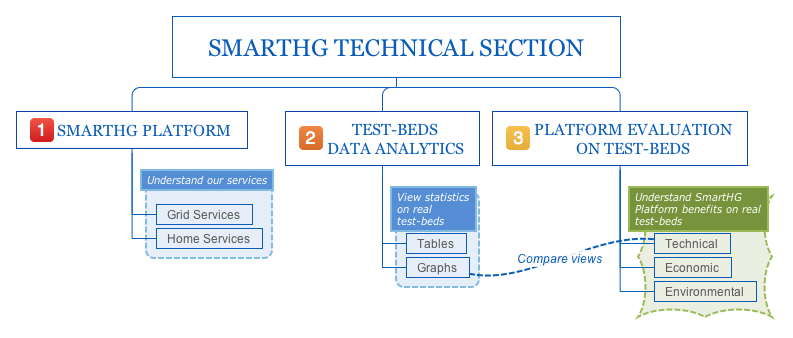
Click on the picture to be redirected to the desired section.
The Technical Section is the place where to know everything about SmartHG Platform, Test-beds, and technical, economic and environmental evaluation of the Platform on our Test-beds.
In this page we show tables on data gathered from our test-beds.
The interface shows three tables:
- Number of measurements showing for each test-bed the number of measurements gathered from deployed sensors and the number of measurement collected through historical data supplied to the SmartHG project
- High-level deployment showing for each test-bed the number of sensors deployed in all houses, both from Develco Products and from Panoramic Power
- Houses deployment details showing for each house in each test-bed the number of sensors deployed, divided by producer (between Develco Products and Panoramic Power) and type of appliance connected (entertainment, food preparation, heating and cooling, lighting, machinery, …)
Finally, this interface is supplied in different languages, namely English, Russian, and Danish. The preferred language can be chosen by clicking on the corresponding flag.
Tables
Select the desired table by clicking on its name.