View Peak Shaving Graphs in This Page
View Costs and CO2 Graphs in This Page
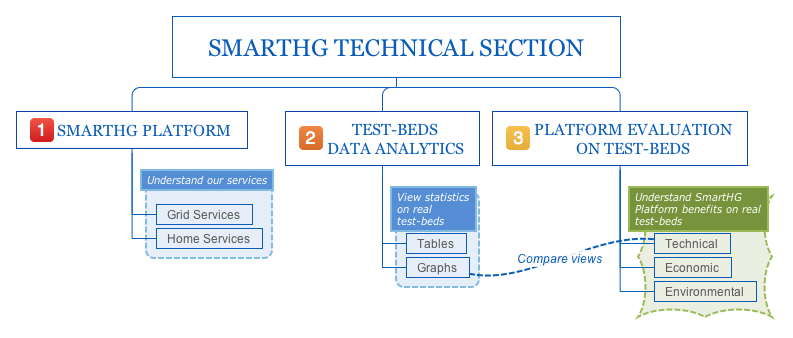
Click on the picture to be redirected to the desired section.
The Technical Section is the place where to know everything about SmartHG Platform, Test-beds, and technical, economic and environmental evaluation of the Platform on our Test-beds.
This page shows economic and environmental evaluation of the SmartHG Platform on a selected part of our test-beds.
Evaluation Setting
Plug-in Electric Vehicles (PEVs) For evaluation purposes, we add, to the electricity demand of each home, the electricity consumption due to one of the PEVs from the data gathered through the Danish project Test-an-EV (https://www.clever.dk/test-en-elbil). More details on such PEV data can be found in our Showcase.
Electricity Prices In our evaluation we use, as day-ahead electricity prices, those from DK2 area of Nord Pool Spot (http://www.nordpoolspot.com) in all test beds, thus simulating the condition in which all users from our test beds are in Denmark (but have different electricity demand patterns from those in Kalundborg). This allows us to evaluate SmartHG services on user demands with different characteristics.
Storage Cost Model SmartHG Home Services (namely, the EBR service) computes the optimal home battery dimensioning taking into account battery prices, day-ahead market electricity cost and historical data about user electricity demand.
We focus on lead-acid batteries by Trojan (www.trojanbattery.com) and estimate the cost in EUR of a battery having capacity c (in kWh) and power rate p (in kW) as 90c + 200p.
We finally amortise the battery cost over a 10 year period. Thus, for example, a battery whose cost is 1,000 EUR will cost for us 100 EUR per year.
Storage Configurations For each test bed we consider five energy storage configurations:
- BU Home Battery, PEV at home can only be charged and charge is not controlled by SmartHG services.
- BC Home Battery, PEV at home can only be charged and charge is controlled by SmartHG services.
- BD Home Battery, PEV at home can be charged and discharged and both are controlled by SmartHG services.
- PC No home battery, PEV at home can only be charged and charge is controlled by SmartHG services.
- PD No home battery, PEV at home can be charged and discharged and both are controlled by SmartHG services.
Note that scenarios BD and PD above both use PEV as a home energy storage device (e.g., as in the project Storage4All http://www.smartgridrendement.nl/nieuwe-diensten/dienst-7)
In the remainder of this page, we show benefits of applying the SmartHG Platform on our Test-beds in the above described scenarios, in terms of optimising EDN operations, reducing demand peaks, electricity costs, and CO2 emissions.
Optimising EDN Operations
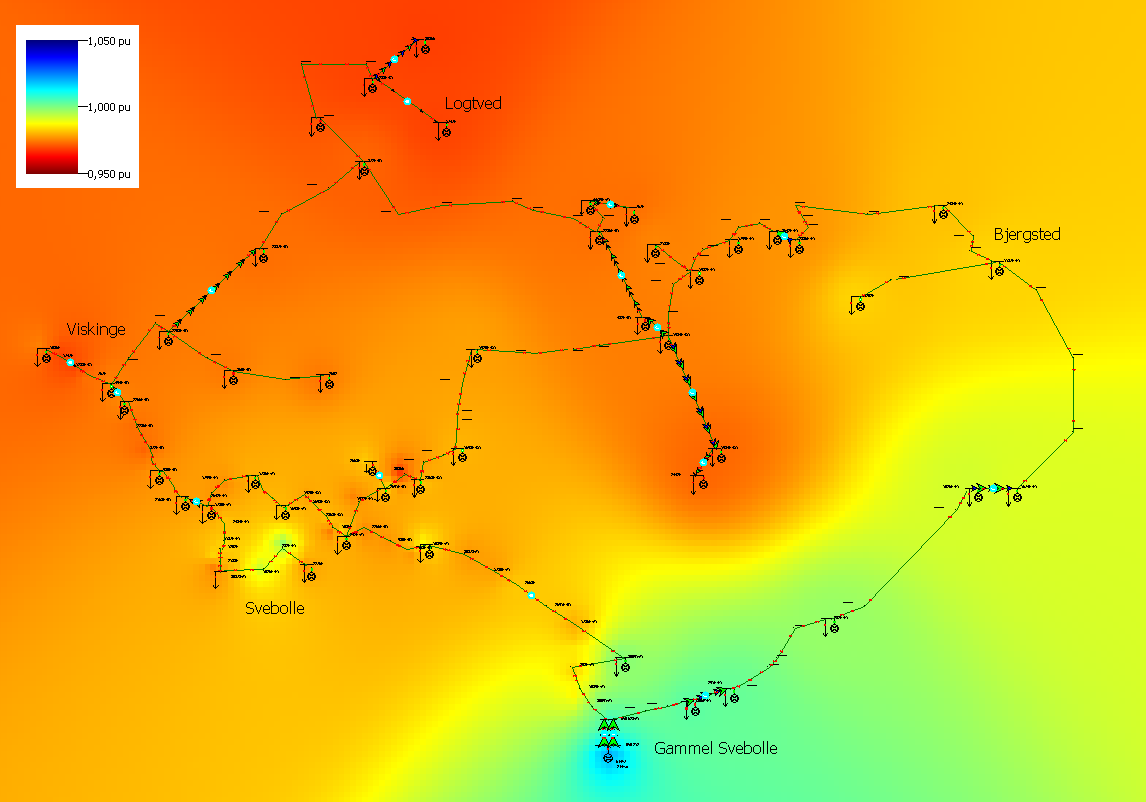
EVT technical evaluation: before corrective actions on Kalundborg.
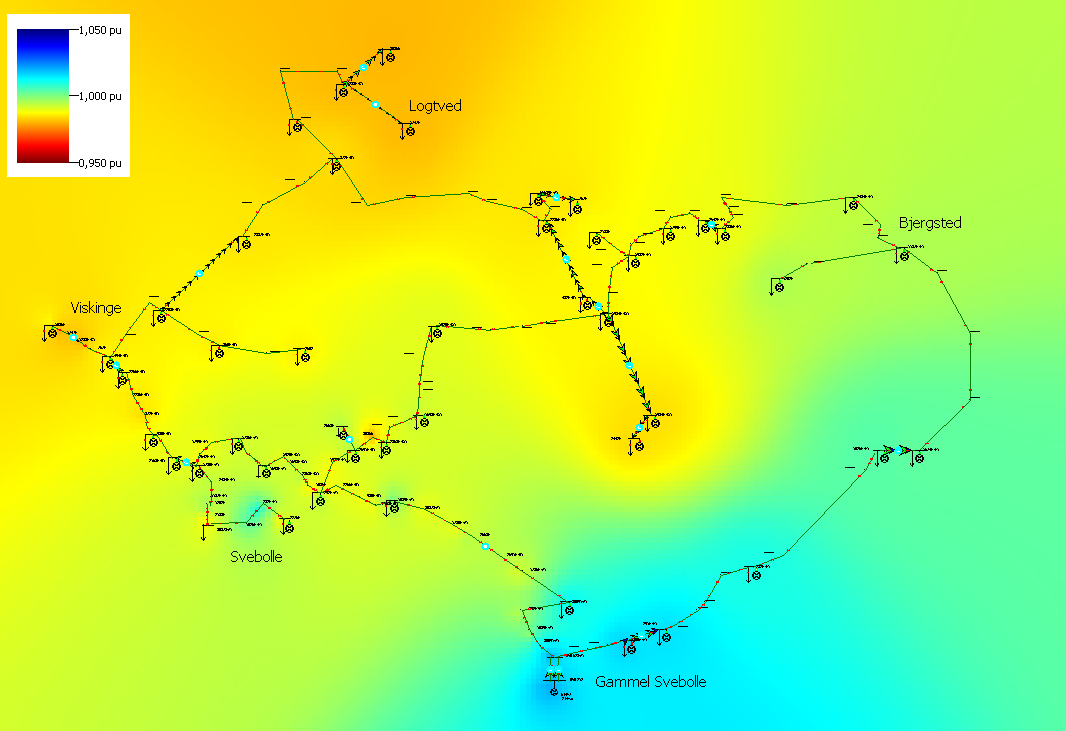
EVT technical evaluation: after corrective actions on Kalundborg.
The main role of the EVT service is to use all of the available measurements and sensor data from the Electric Distribution Network (EDN) to provide an accurate estimate of the system state. This is designed to improve the DSOs visibility of the Medium Voltage (MV) part of the network, through providing “virtual” measurements even in parts of the network where no sensor data is available. This is achieved through computer modelling of EDN and using the forecasting and state estimation techniques on top of which EVT rests and outlined in SmartHG reports.
We have used the PowerWorld Simulator for visualising DSO load. As an example, we can see benefits of our platform in optimising EDN operations thanks to figures “EVT technical evaluation” before (left) and after (right) applying corrective actions on Svebølle test-bed.
Note that in the situation before (left), low voltages occur in parts of the network which are further from the primary substation whereas, after applying EVT recommendations (right), the voltage has reached a normal level throughout the system thus optimising EDN operations.
Reducing Demand Peaks
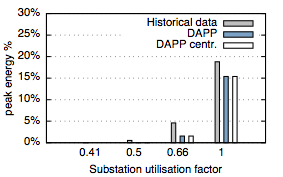
SmartHG distributed energy storage vs. centralised storage: peak shaving effectiveness.
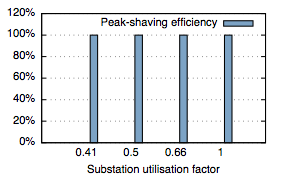
SmartHG distributed energy storage vs. centralised storage: peak shaving efficiency.
The SmartHG Grid Service computing power profiles for all users connected to a substation (on the basis of constraints provided by the DSO through SmartHG Grid Service EVT) is Demand Aware Price Policies (DAPP).
Peak shaving yields an economic saving (as investment deferral) that the DSO may harvest by distributing electricity through a less congested (thanks to peak shaving) EDN. However, the exact amount of such an economic saving strongly depends on the EDN characteristics and its congestion level.
We measure the congestion level of a given substation through the substation utilisation factor defined as the ratio between the annual aggregated energy demand from users and the energy that the substation can provide in one year without ever exceeding its nominal power.
The following figures show statistics about effectiveness of SmartHG Grid Services.
Chart “SmartHG distributed energy storage vs. centralised storage: peak shaving effectiveness” shows how the peak shaving effectiveness changes with the substation utilisation factor. For each substation utilisation factor value considered we have a group of 3 vertical bars. The first bar in each group shows historical data about the percentage of annual energy consumption that exceeds the substation power limit (peak energy percentage). The second bar in each group shows the same data when SmartHG Grid Services (namely DAPP and PPSV) are used to manage user demand so as to keep, as much as possible, the substation power level below its nominal value. Finally, the third bar in each group shows the same data when centralised storage (with capacity and power rate equal, respectively, to the sum of capacities and power rates of the energy storage devices installed at homes) is used to flatten the aggregated demand. Although a distributed storage approach has many advantages with respect to a centralised one (e.g., a pay-as-you-go schema is possible and there is no single-point-of- failure), it will always be as most as effective as a centralised one.
From Chart “SmartHG distributed energy storage vs. centralised storage: peak shaving efficiency” we can see that, as for flattening user demand, thanks to the control strategy provided by SmartHG Grid Services, SmartHG distributed storage is only slightly less effective than a centralised energy storage approach.
Reducing Demand Peaks using Home Services
While in previous section we show peak shaving effectiveness as the percentage of demand outside substation bounds, in the following graphs we show effectiveness of EBR (Home Service) following DAPP power profiles. The following interface shows percentage of homes demand outside DAPP individualised power profiles, both at a residential level (for each house in one test-bed) and at substation level (by averaging percentages over all houses).
Reducing Electricity Costs
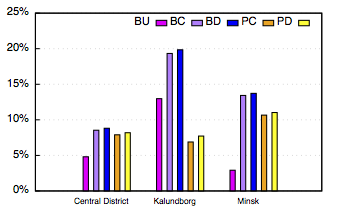
Average energy cost saving percentage among users in each test bed.
The SmartHG platform enables saving on the energy costs by leveraging on price differences during the day. That is, we can buy electricity when its price is low, store it and then use it when the electricity price is high (arbitrage).
On basis of our Electricity Prices, we can compute the average (over one year, among test bed households) energy cost per MWh. For Central District, Kalundborg and Minsk we have, respectively, 77.54 EUR/MWh , 102.70 EUR/MWh and 88.61 EUR/MWh.
Using as a reference such energy costs, bar chart in picture “Average energy cost saving percentage among users in each test bed” shows, for each test bed and for each home storage configuration above, the average energy cost saving percentage (among all test bed users) enabled by SmartHG Home Services.
Reducing CO2 Emissions
Using SEAS data for Denmark market, we can compute the CO2 emissions from historical data.
For each test bed and for each home storage configuration, we insert here figures showing statistics about the attained CO2 emissions reduction.
Figure “Average CO2 emissions reduction per MWh of annual household electricity consumption” shows the average (among all test bed users) reduction in CO2 emissions for each MWh of annual electricity consumption.
Figure “Average percentage CO2 emissions reduction” shows the average (among all test bed users) percentage reduction in CO2 emissions.
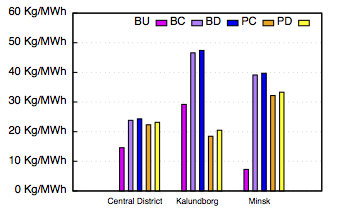
Average CO2 emissions reduction per MWh of annual household electricity consumption.

Average percentage CO2 emissions reduction.
More Graphs on Energy Costs and CO2 Emissions Reductions
The following interface permits to navigate through all economic and environmental benefits obtained thanks to SmartHG technology.
In particular, we have run EBR (home services) on houses of all our test-beds with different goals:
- Reducing CO2 emissions
- Reducing electricity costs and CO2 emissions
- Reducing electricity costs and CO2 emissions and following DAPP proposed power profile (with high and very high substation load)
Once a mode is chosen, we show the gross and net cost savings per MWh (and percentage), the CO2 emissions reduction per MWh (and percentage).