Click on the picture to be redirected to the desired section.
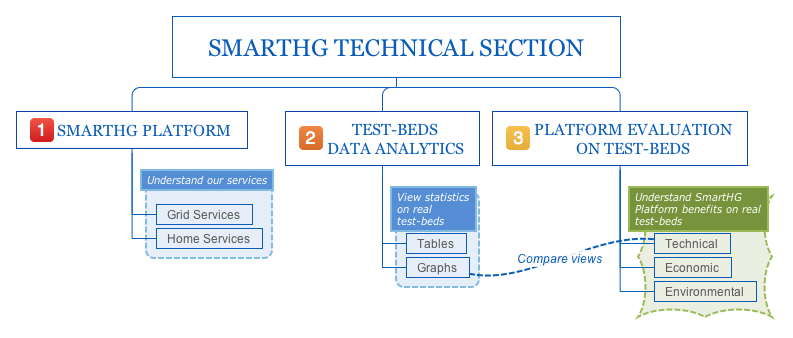
The Technical Section is the place where to know everything about SmartHG Platform, Test-beds, and technical, economic and environmental evaluation of the Platform on our Test-beds.
As shown in the pictures at the bottom of the page, SmartHG Test-beds spread over three different locations:
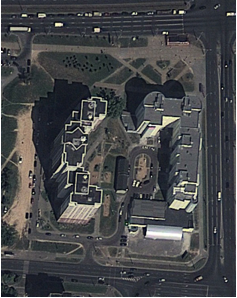
- Central District (Israel).
- Minsk (Belarus).
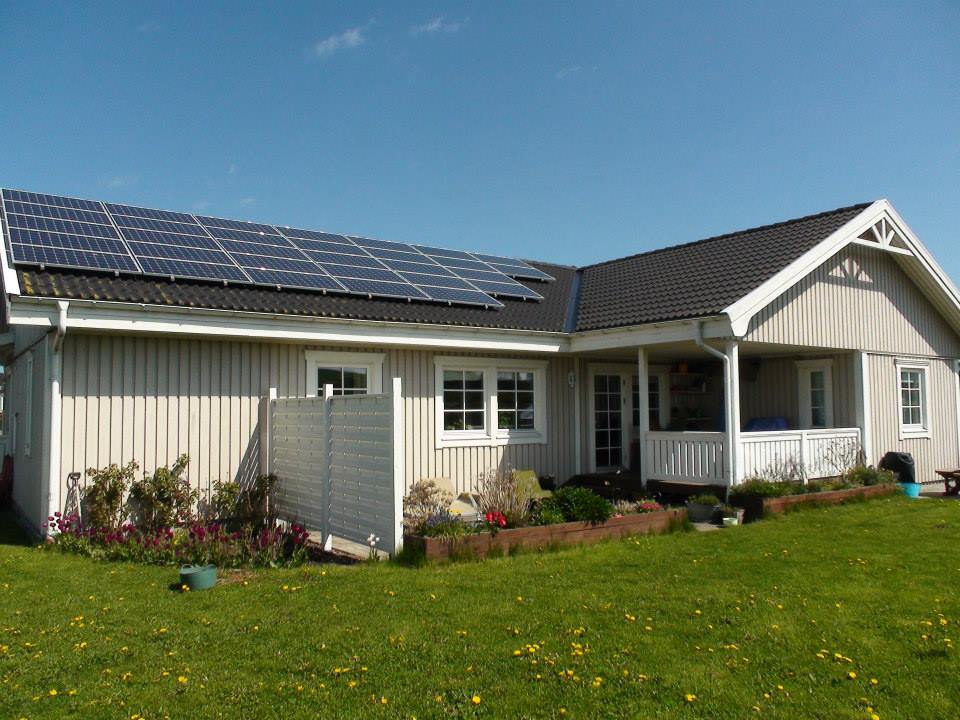
- Svebølle (Denmark).
A selection of houses in our test-beds of Svebølle and Central District have been equipped with sensors from SmartHG partners Develco Products and Panoramic Power.
As for our Minsk test-bed, we consider historical data supplied by partner MinskEnergo.
Measurements gathered from such sensors have been stored in the DB&A service, developed by SmartHG partner Aarhus University, and in the industrial web application PowerRadar™ Dashboard, developed by SmartHG partner Panoramic Power. Data are secured, for security and privacy issues, and we expose statistics and analytics on such data in terms of:
- Tables showing the number of measurements stored in our services (taken both from deployed sensors and from historical data), the number of sensors deployed in all houses, and for each house in each test-bed the number of sensors deployed, divided by producer.
- Graphs showing significant aggregations at substation level (aggregations and averages on users demand) and at residential level.
.
.
Svebølle, Denmark
.
Minsk, Belarus
.
.
.
.
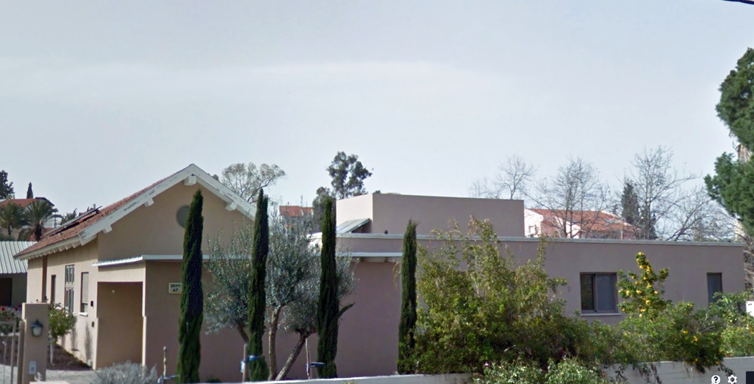
Central District, Israel