View Graphs in This Page
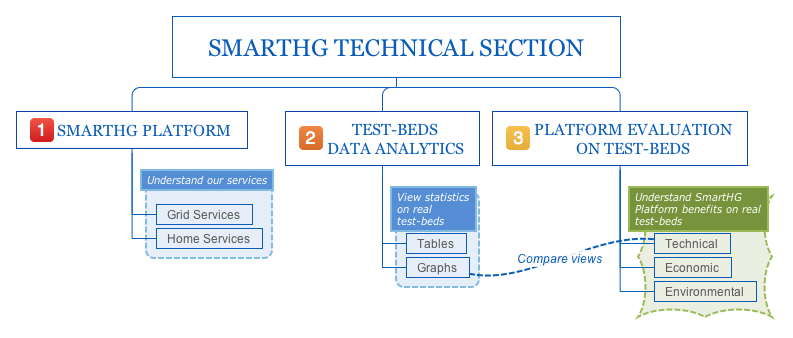
Click on the picture to be redirected to the desired section.
The Technical Section is the place where to know everything about SmartHG Platform, Test-beds, and technical, economic and environmental evaluation of the Platform on our Test-beds.
This page shows technical evaluation of the SmartHG Platform on a selected part of our test-beds. In particular, this is the place where we highlight the reduction in energy usage.
Graphs
This interface allows to understand energy usage changes as a result of applying the SmartHG Platform to our test-beds. The evaluation setting is described in the page for economic and environmental evaluation.
In particular, we show data analytics on demand and consumption when applying several EBR storage control strategies.
First choose a test-bed by clicking on the drop-down menu. When choosing a test-bed for evaluation, the interface shows analytics (the same as you can find in Data Analytics Graphs) on “clean” measurements taken from our test-beds, increased with PEV consumptions gathered through the Danish project Test-an-EV (https://www.clever.dk/test-en-elbil) for evaluation purposes.
To see statistics on demand and consumption when applying SmartHG Platform, it is enough to choose a storage configuration (as described in economic and environmental evaluation) and an EBR storage control strategy. We show evaluation for the following EBR modes:
- EBR aims at minimising only CO2 emissions
- EBR aims at minimising energy cost and CO2 emissions
- EBR aims at minimising energy cost, CO2 emissions, still trying to follow a DAPP proposed power profile (computed for very high and high substation load)
Data analytics can be chosen at substation or residential level, each one allowing a set of useful views.
The best way of enjoying this interface is by opening two instances at the same time (e.g., in two different browser windows placed side by side), one for a view without experiment and one for the same view on the same test-bed with some EBR control strategy enabled. This enables looking at differences on all views. Moreover, for demand profile view at residential level when looking at original demand it is possible also to enable visibility of power profiles generated by DAPP for one experiment. Thanks to this feature, it is possible to compare demand profiles with and without EBR controlling house storage, also noticing small differences in following power profiles.