This page contains the public SmartHG project showcase. You can navigate through the following information:

Deployed Hardware
SmartHG platform is being evaluated through three test-beds, which are residential buildings from Minsk (Belarus) and residential house from Svebølle (Denmark) and Central District (Israel). SmartHG compliant sensors and equipment were installed in 44 houses.
These equipments include:
Wireless current sensors
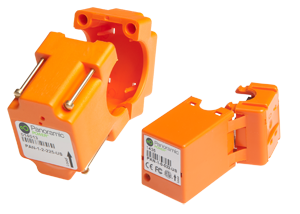
- Easy install
- Wireless, Self Powered
- Real time
Communication Bridge
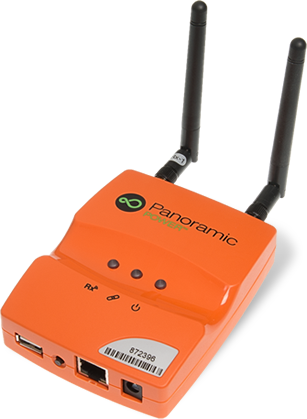
- Connecting site data to cloud
- Accumulating data
- Utilizing WIFI/LAN/3G
3 phase power meter
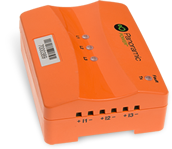
- Wireless for 3 phase
- Active/reactive power
- Total kWh
How it works

- Harvest and send data
- Transmit data to the cloud
- Show energy consumption
SmartPlug
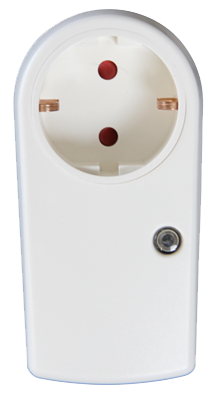
- Secure communication
- On/Off relay
- Monitor power consumption
- Data logging
- Easy installation
Ethernet Gateway

- Supporting up to 40 devices
- With IP Functions
- Configuration can be changed
- AES128 encryption
- Upgradeable via TCP/IP
Temperature sensor

- Interval can be defined
- With a resolution of 0.1°C
- ZigBee Pro End device
- Sleeping device
- Battery 2 x AAA
MEP module for Smart Meter
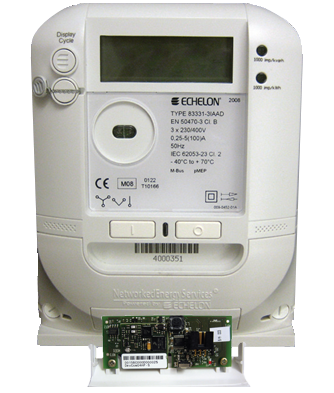
- Up to 1 second interval
- With a resolution of 0.1°C
- Secure communication
- Read values on request
- Powered by the meter
Home Energy Controlling Hub
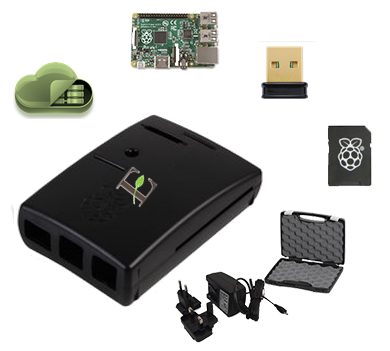
- Open platform
- Multiprotocol support
- Web services support
- Data-cloud connectivity
- Access to information sources
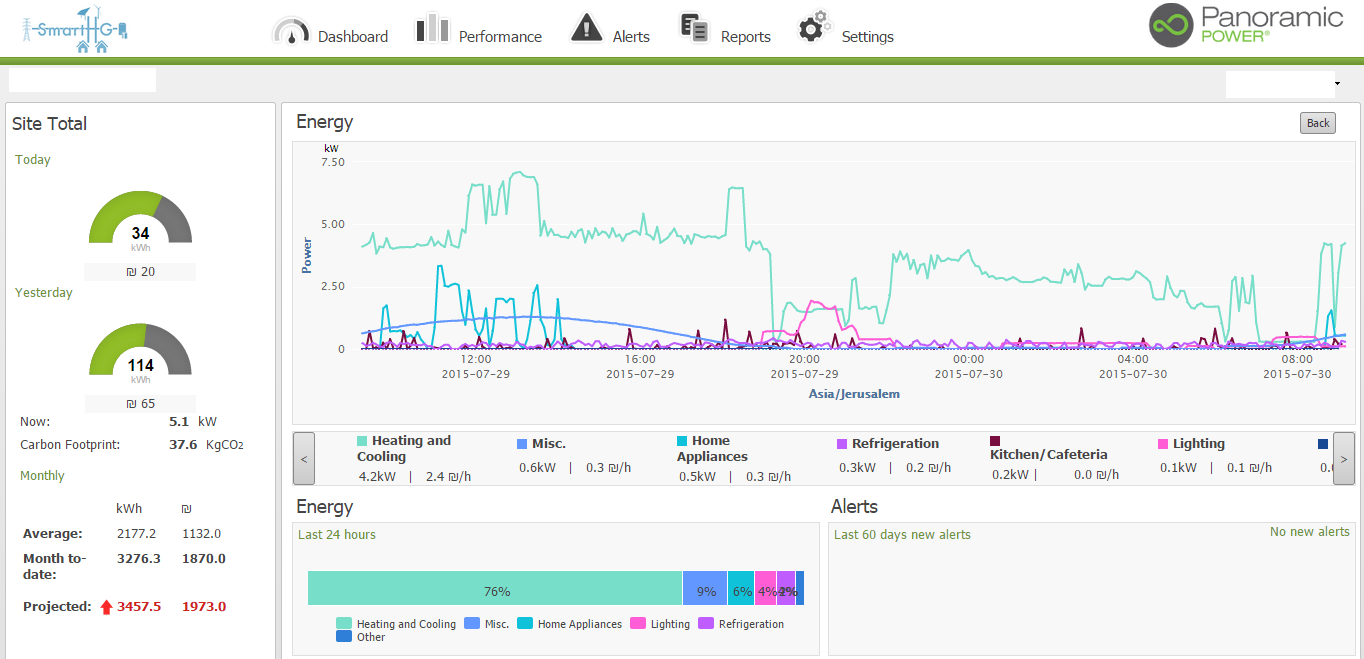
Showcase on Industrial Website: Residential User Monitors Consumptions through Panoramic Power Dashboard
SmartHG project showcases on Panoramic Power industrial website the data gathered by sensors deployed in the project test-beds, resting on the Panoramic Power PowerRadar™ dashboard.
In the following document, you can find a description of PowerRadar™ Software by Panoramic Power.
Public Showcase: Screenshots from Panoramic Power Dashboard
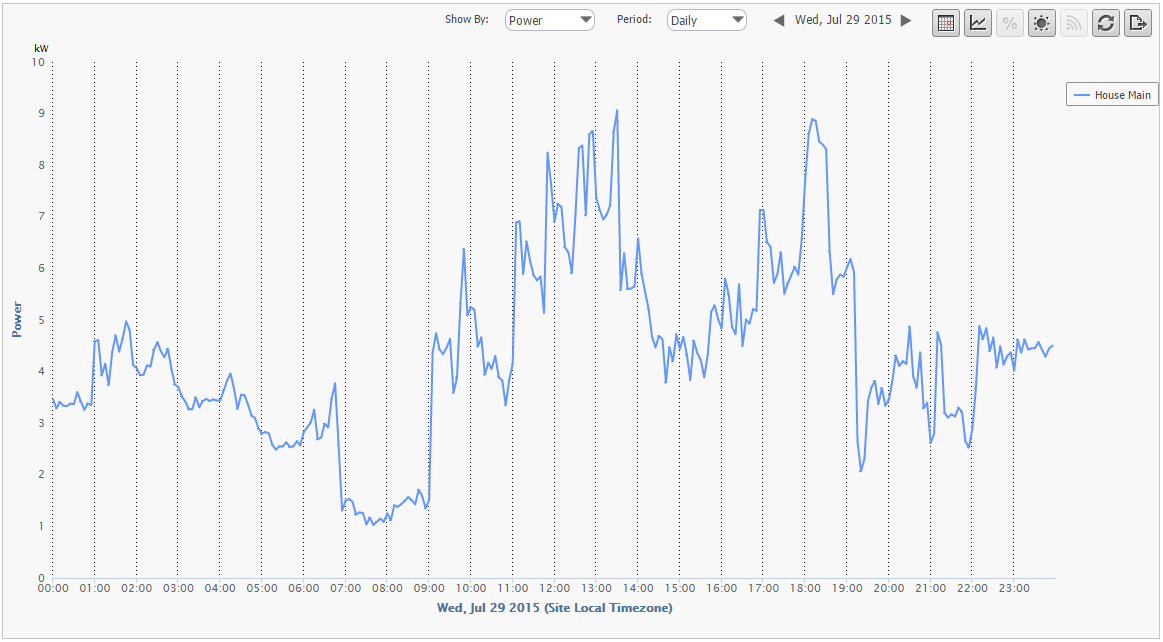
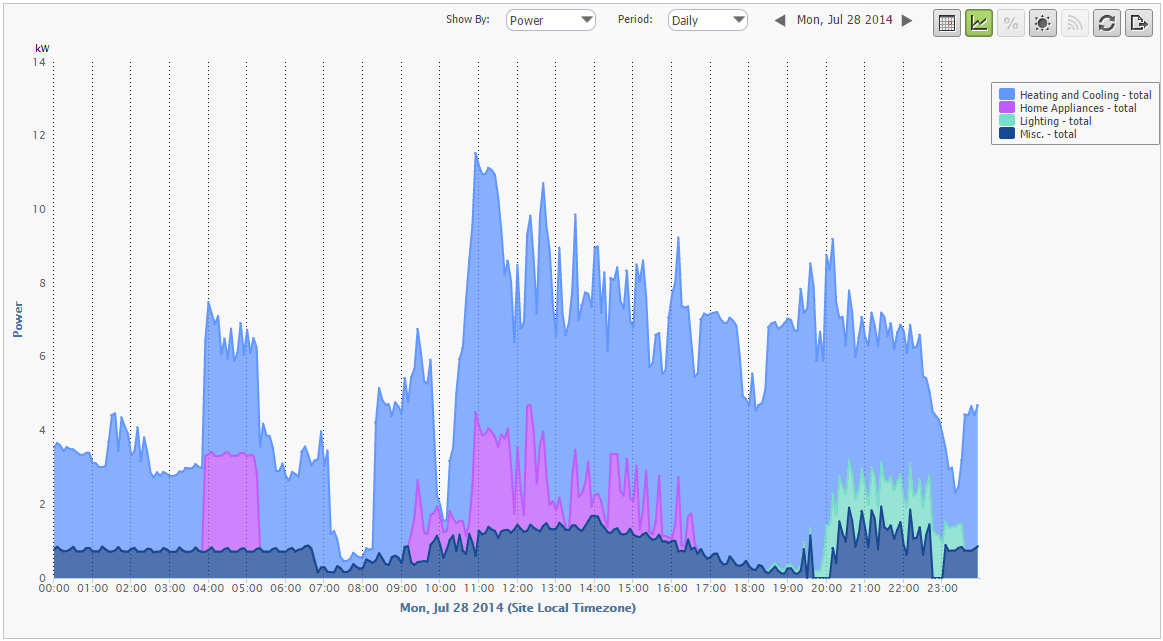
The sensors deployed in the residential homes of the SmartHG test-beds allow the project to collect information on the electrical consumption of the home. As can be seen in the screenshots below, the data collected can be displayed in numerous ways on the Dashboard, enabling the various users (the project partners, the homeowners, etc) to receive the information they need. This includes seeing only the entire home’s consumption (mains), or just a specific appliance or category. It includes the time frame shown, be it hourly, daily, monthly, etc.
Each homeowner was given a unique user ID and password to view their own home consumption, and the project partners (and other future users, e.g. electric grid managers) have IDs that allow them to see the aggregate consumption of all homes, as well as zooming in on a specific home, a specific category of appliances, etc.
It is possible to navigate the screenshots below by clicking on one of them and then using the arrow keys.
Typical Daily Profile – Mains
Typical Daily Profile – Stacked by Categories
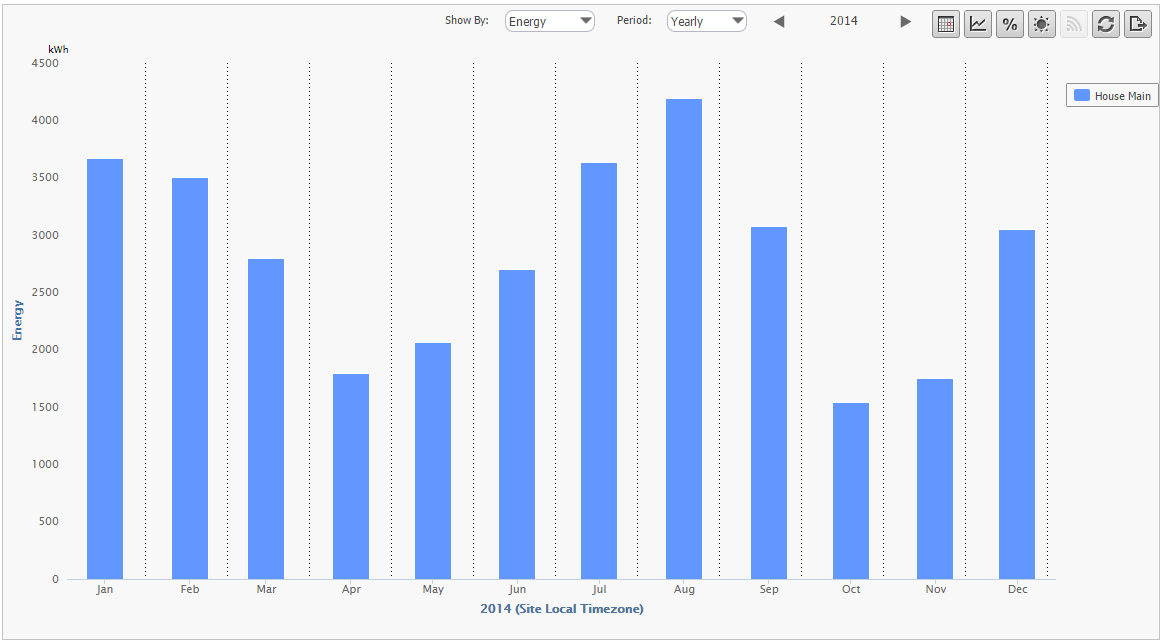
Annual Energy Bar Chart – Mains
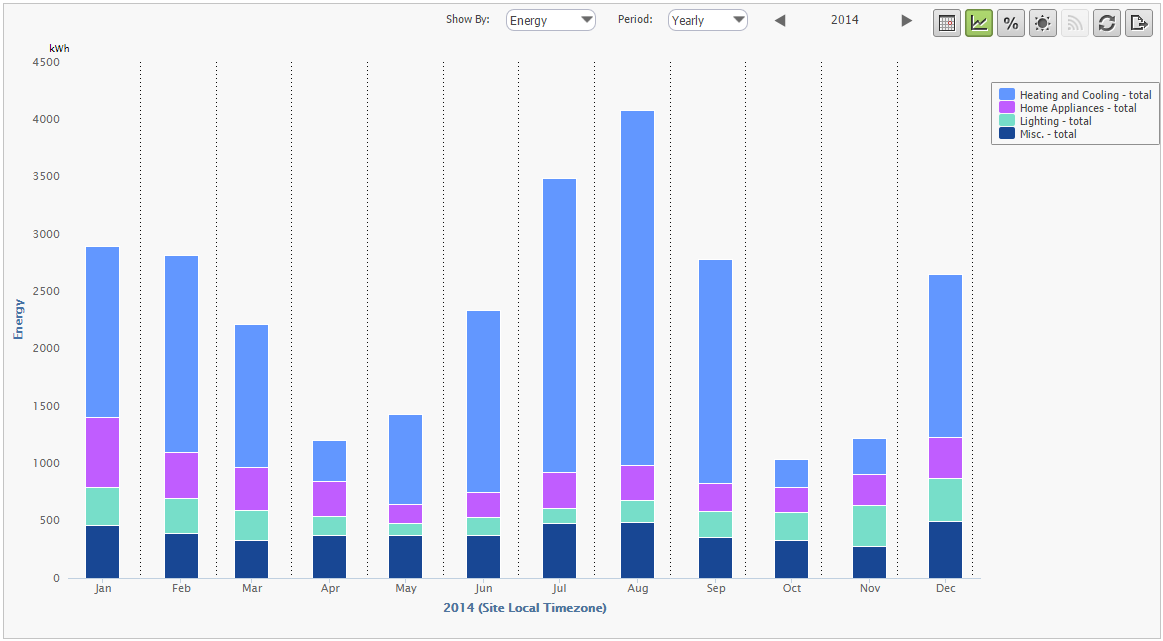
Annual Energy Bar Chart – Stacked by Category
General Overview
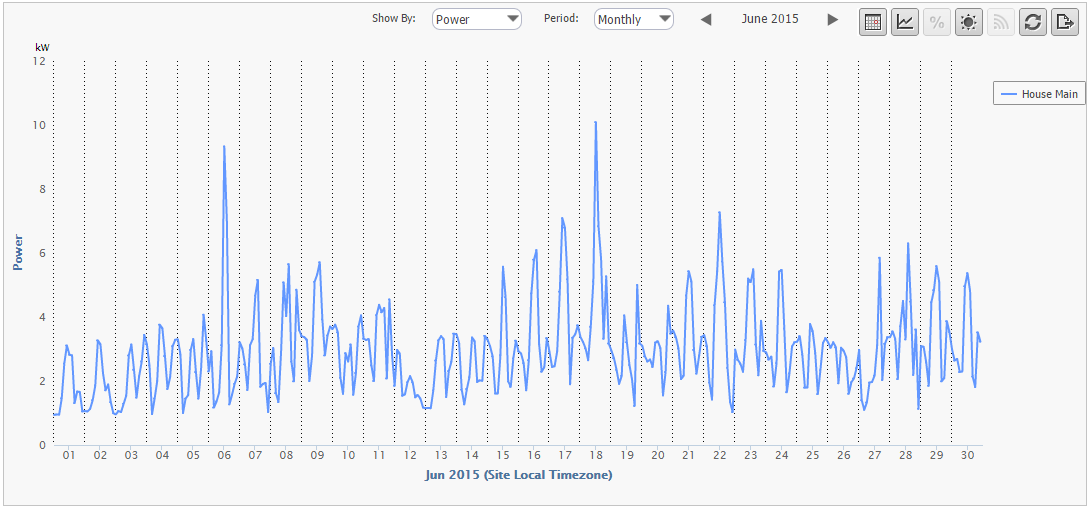
House Main Power Consumption – Monthly View
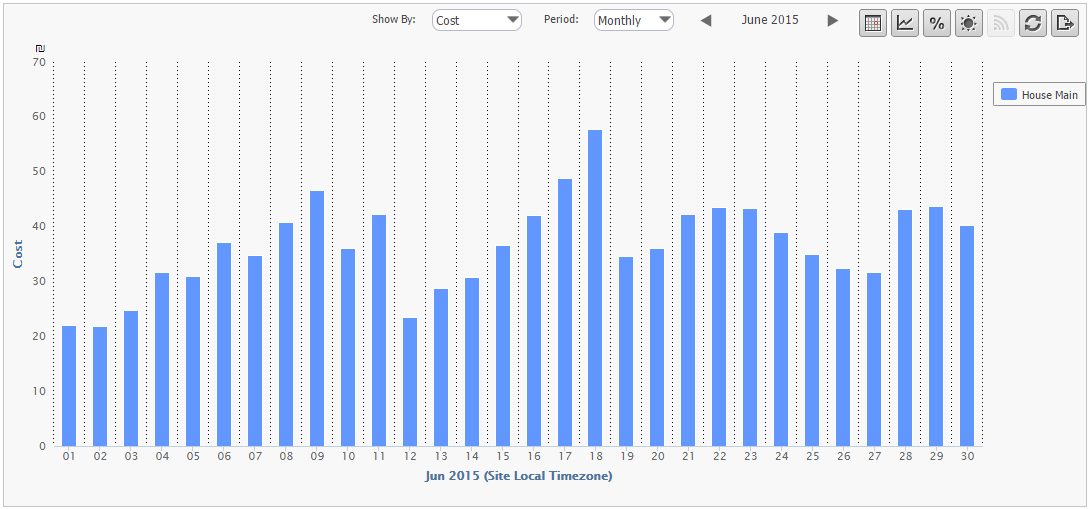
Daily Cost – Monthly View
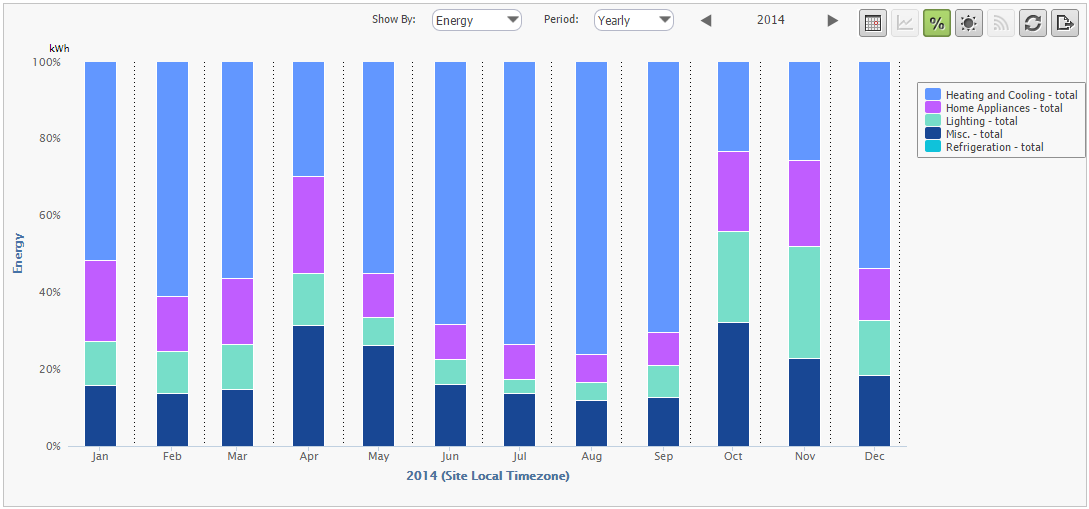
Annual Usage Analysis by Category
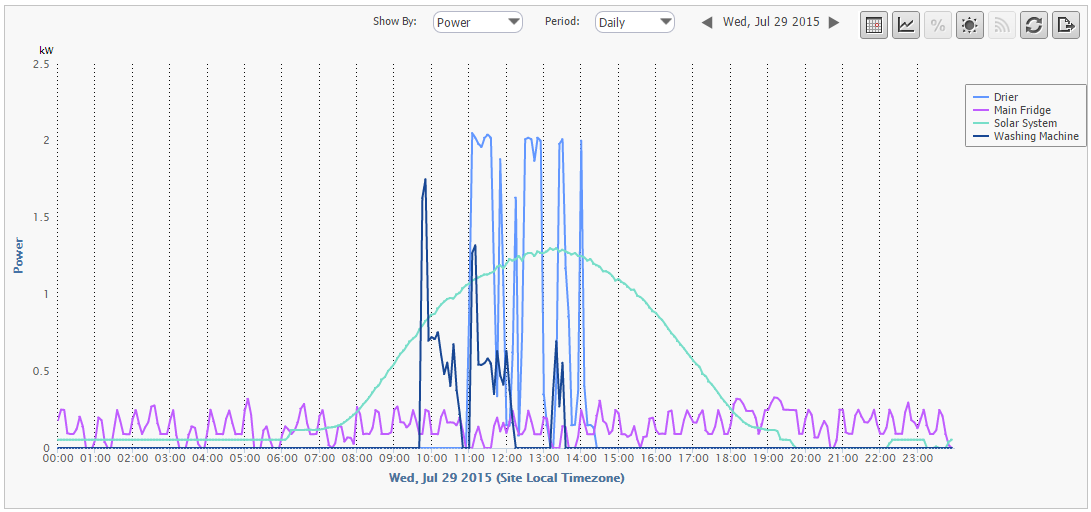
Device Level Daily View
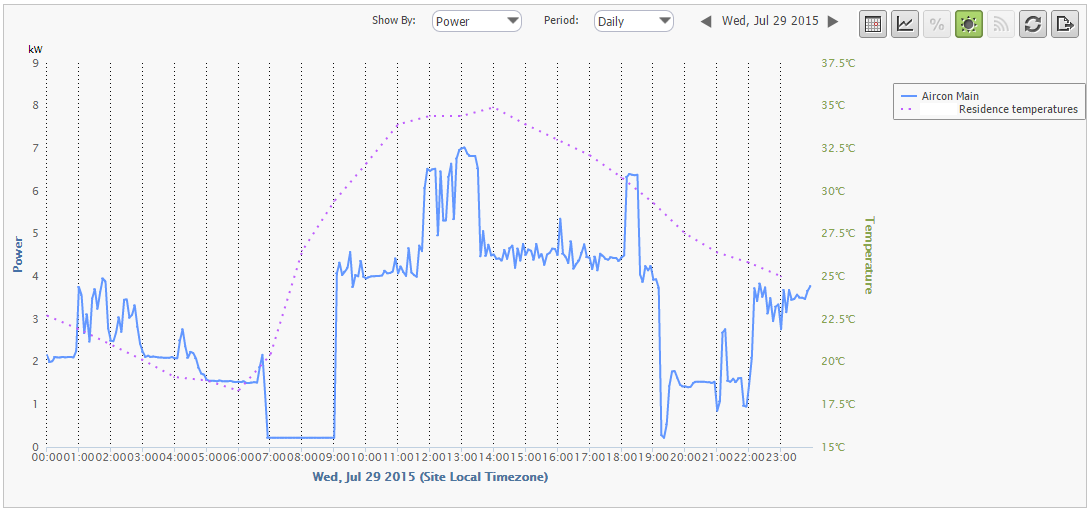
AC Consumption vs. Outside Temperature – Daily View
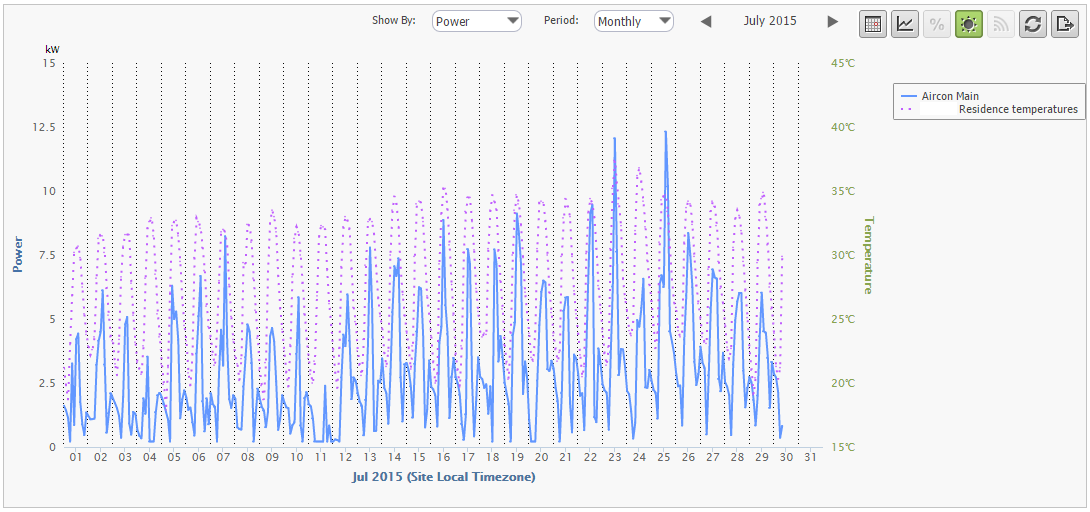
AC Consumption vs. Outside Temperature – Monthly View
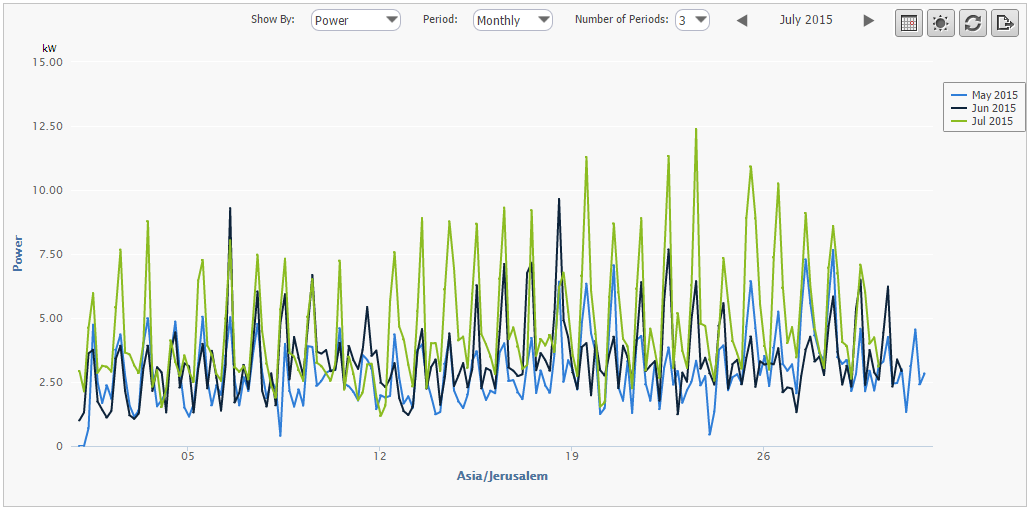
Periodical Overlay – Multiple Months Comparison
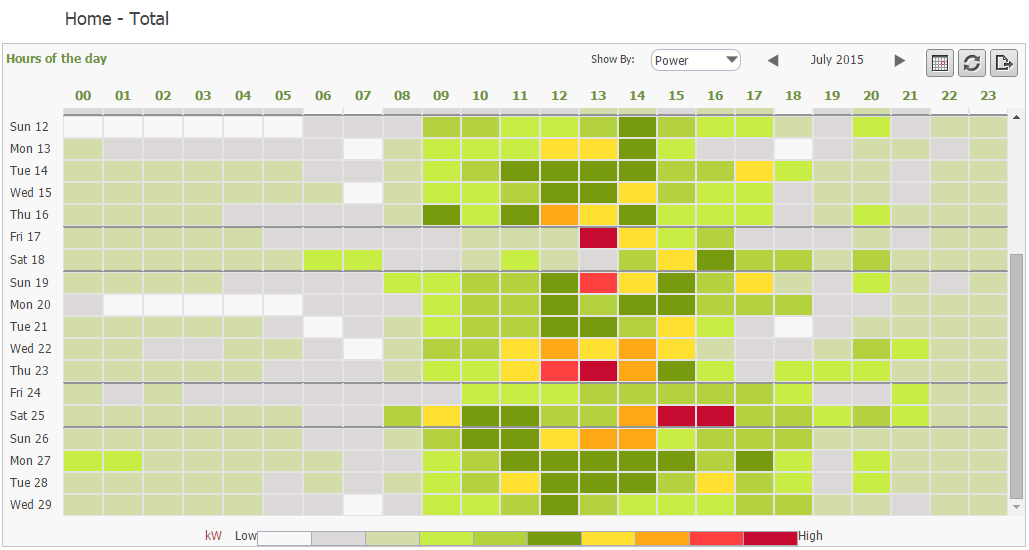
Monthly Heat Map
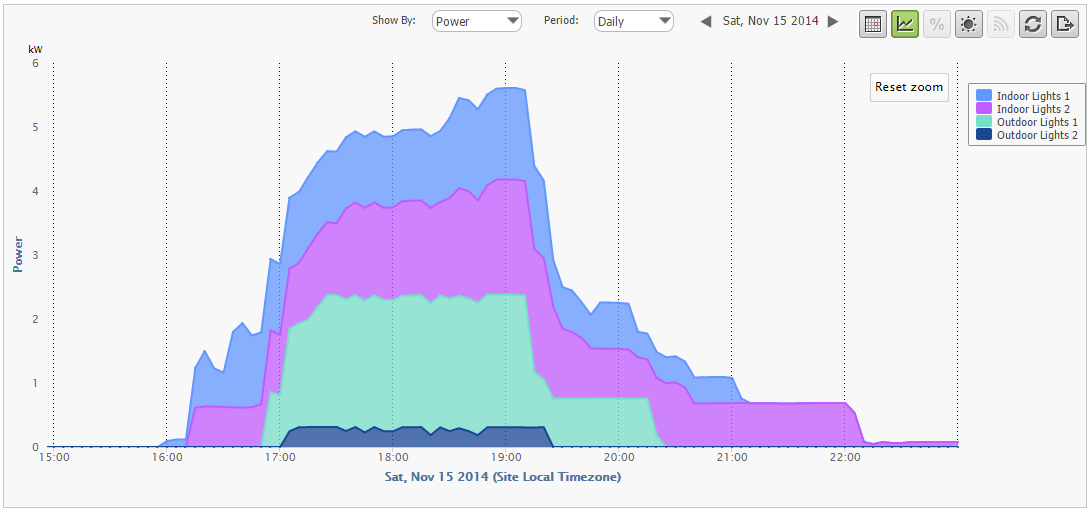
Stacked Bar View for Lighting
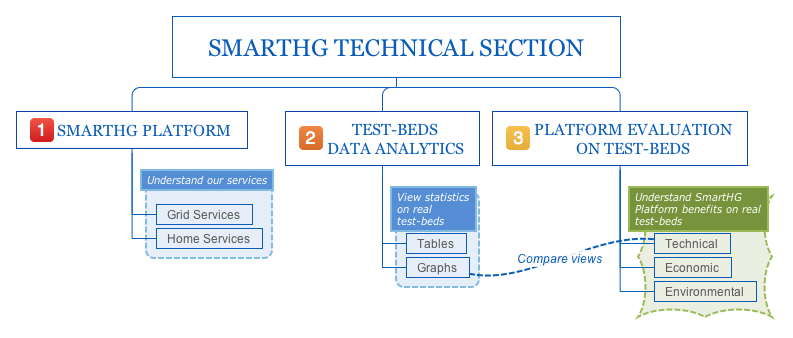
Technical Section
The Technical Section is the place where to know everything about SmartHG Platform, Test-beds, and technical, economic and environmental evaluation of the Platform on our Test-beds.
Data on Plug-in Electric Vehicle (PEV) usage from Other Projects
A SmartHG test-bed has been deployed at IMDEA Smart Energy Integration Lab (SEIL) where we drive Micro grid loads and generators using data from SmartHG residential home test-beds and we drive Micro grid batteries using data from Plug-in Electric Vehicle (PEV) usage (recorded from the Danish project Test-an-EV) and SmartHG services. This allows us to carry out experiments with actuation much as if we were in one of the homes in our test-bed equipped with a PEV and a battery.
The next document shows the data on PEV usage gathered from Test-an-EV project and used in SmartHG project.